

Every component on 35 towers, photographed and graded by severity
Measurable Results
Overview
UNARETI is one of Italy’s largest electricity distribution operators. Part of its network runs through Alpine terrain in the north of the country, where the conditions that make a line difficult to build are exactly the conditions that make it difficult to inspect.
Tidalis surveyed and inspected a 7.5 km stretch of 60 kV line — 35 towers end to end — using drone-mounted LIDAR followed by fully automated visual inspection flights. Three days of field activity, ten flight hours, no personnel at height, and a structured digital record of every tower delivered back to the client.
Challenge
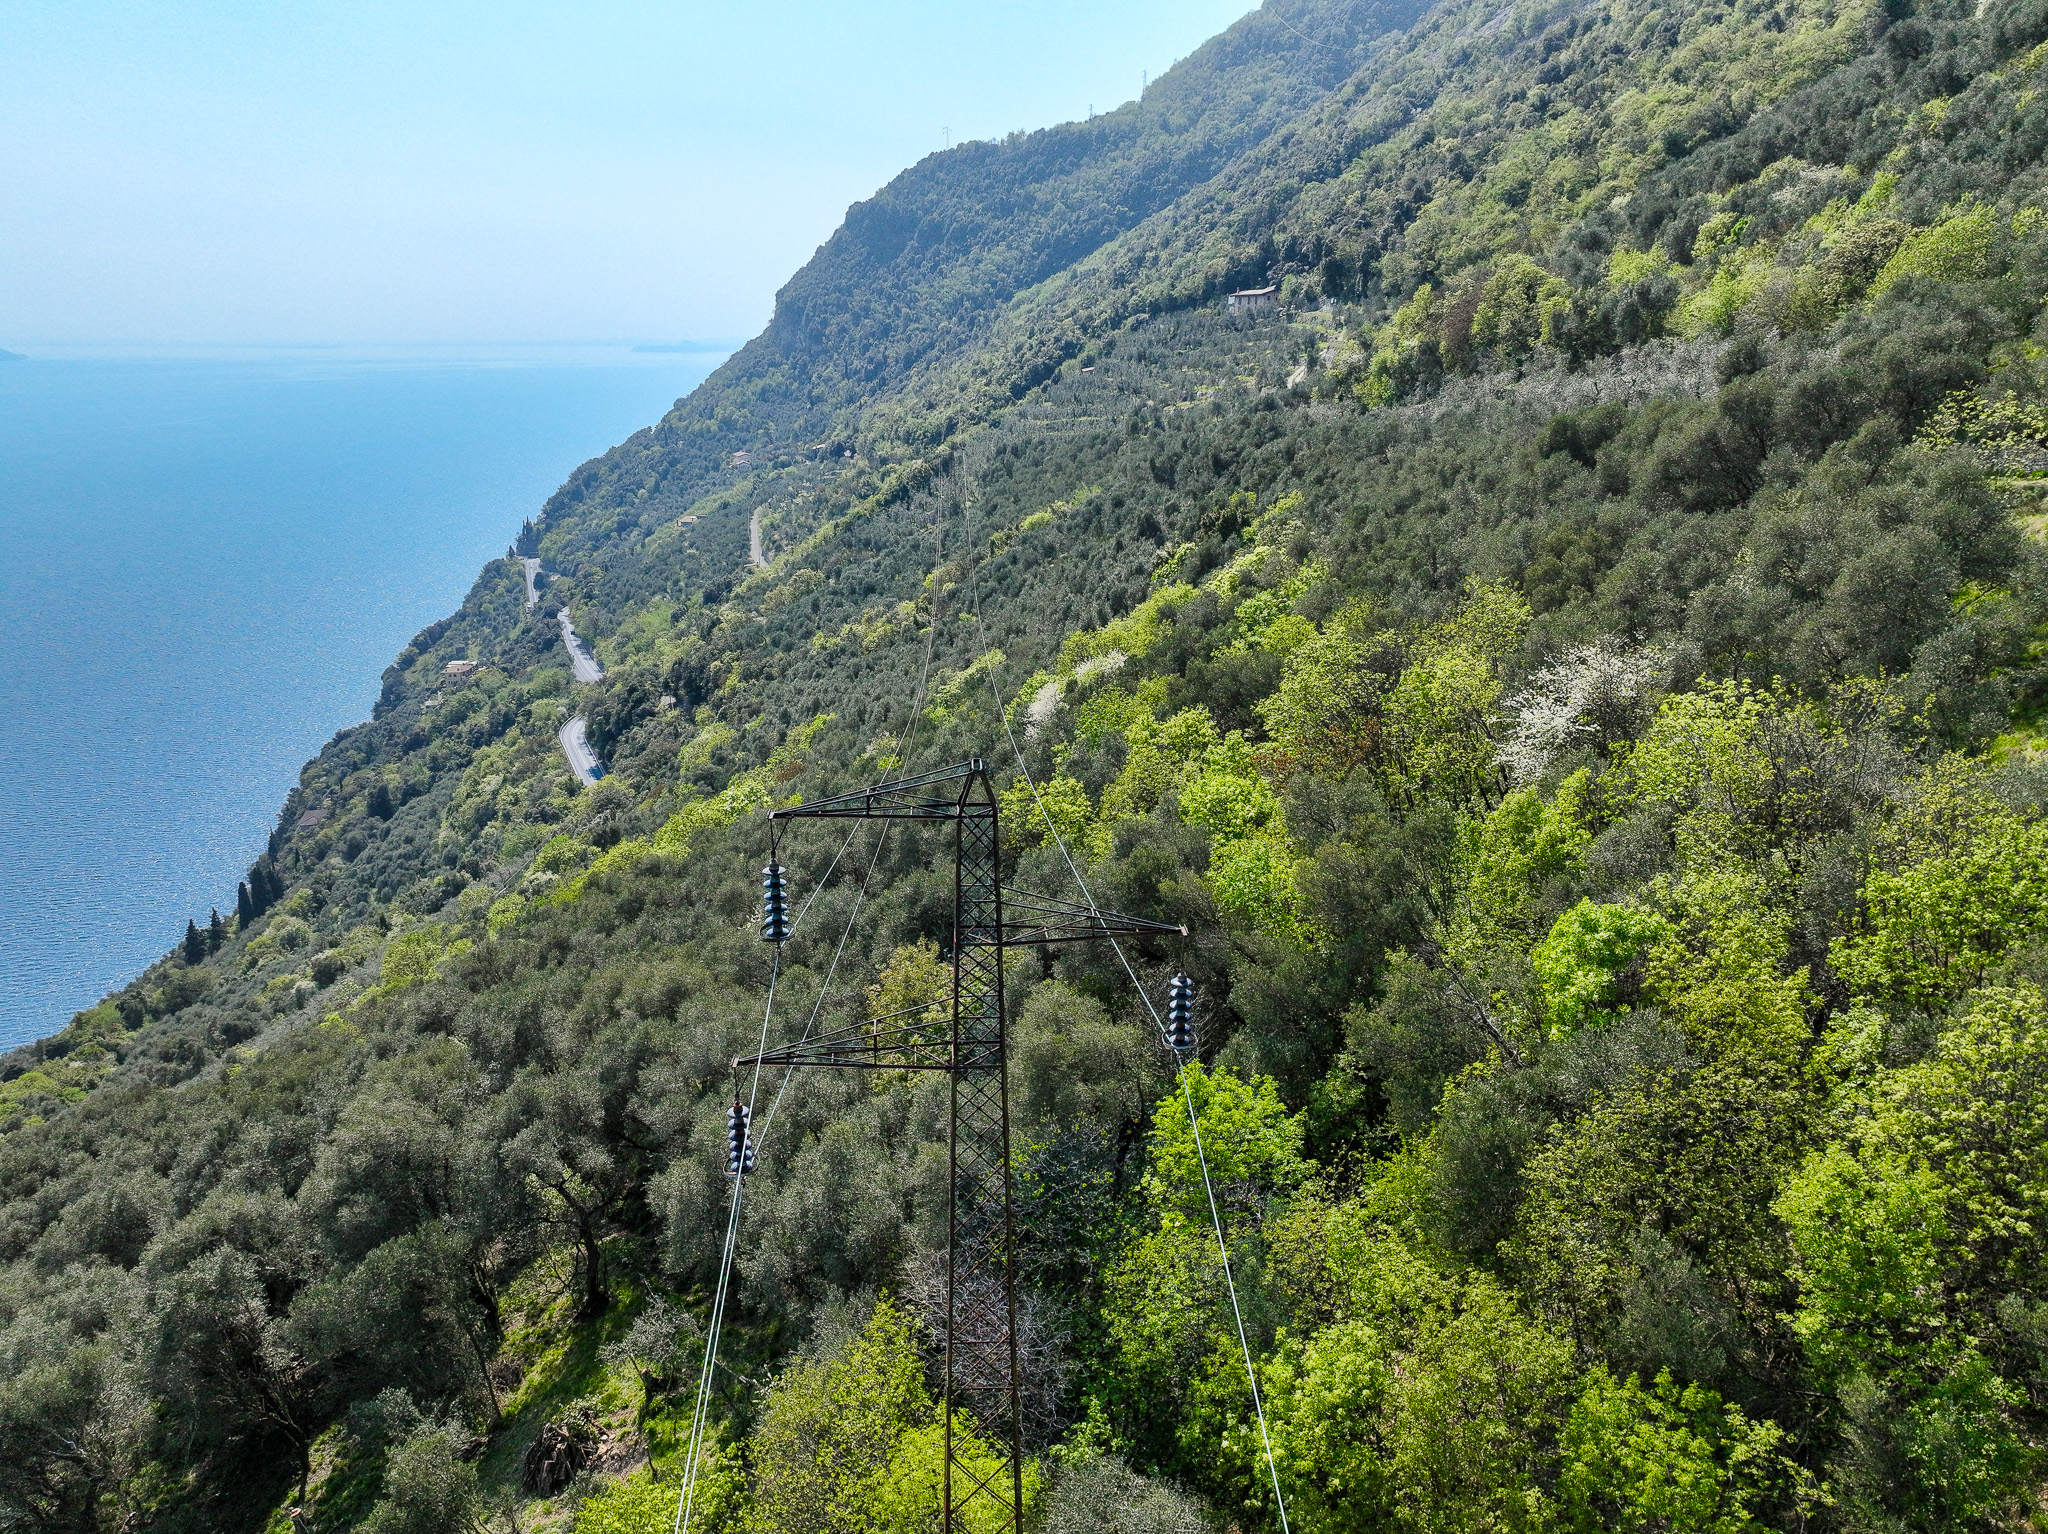
Mountain orography, difficult vehicle access, and short operating windows dictated by Alpine weather set the terms of the job before any method was chosen. Several tower positions could only be reached on foot. Vegetation had encroached on parts of the corridor, and sections of the route pass close to private property, adding a permissions layer to an already constrained schedule. The infrastructure itself was partly decommissioned and partly degraded — a difficult combination to inspect conventionally, because the parts that matter most are the parts hardest to justify sending a climbing team to.
Conventional inspection answers all of this with people at height: a climbing team, or a platform where the terrain allows one, working component by component, weather permitting. The exposure is real and it is accepted as the cost of doing the job.
What comes back from it is the second problem. A conventional inspection produces a judgement recorded in a report — what an inspector noticed, from where they were standing, at the resolution the human eye offers, at the end of a long day. Coverage depends on attention. There is no going back to look again at a fitting nobody had a reason to photograph, and no way to compare this year’s condition against last year’s other than by reading two reports side by side. For an operator trying to decide which of 35 towers to work on first, that is not enough to plan from.
Solution
Tidalis ran the campaign in two passes, and the order matters: the LIDAR survey is not just a deliverable, it is the input that makes the second pass automatic.
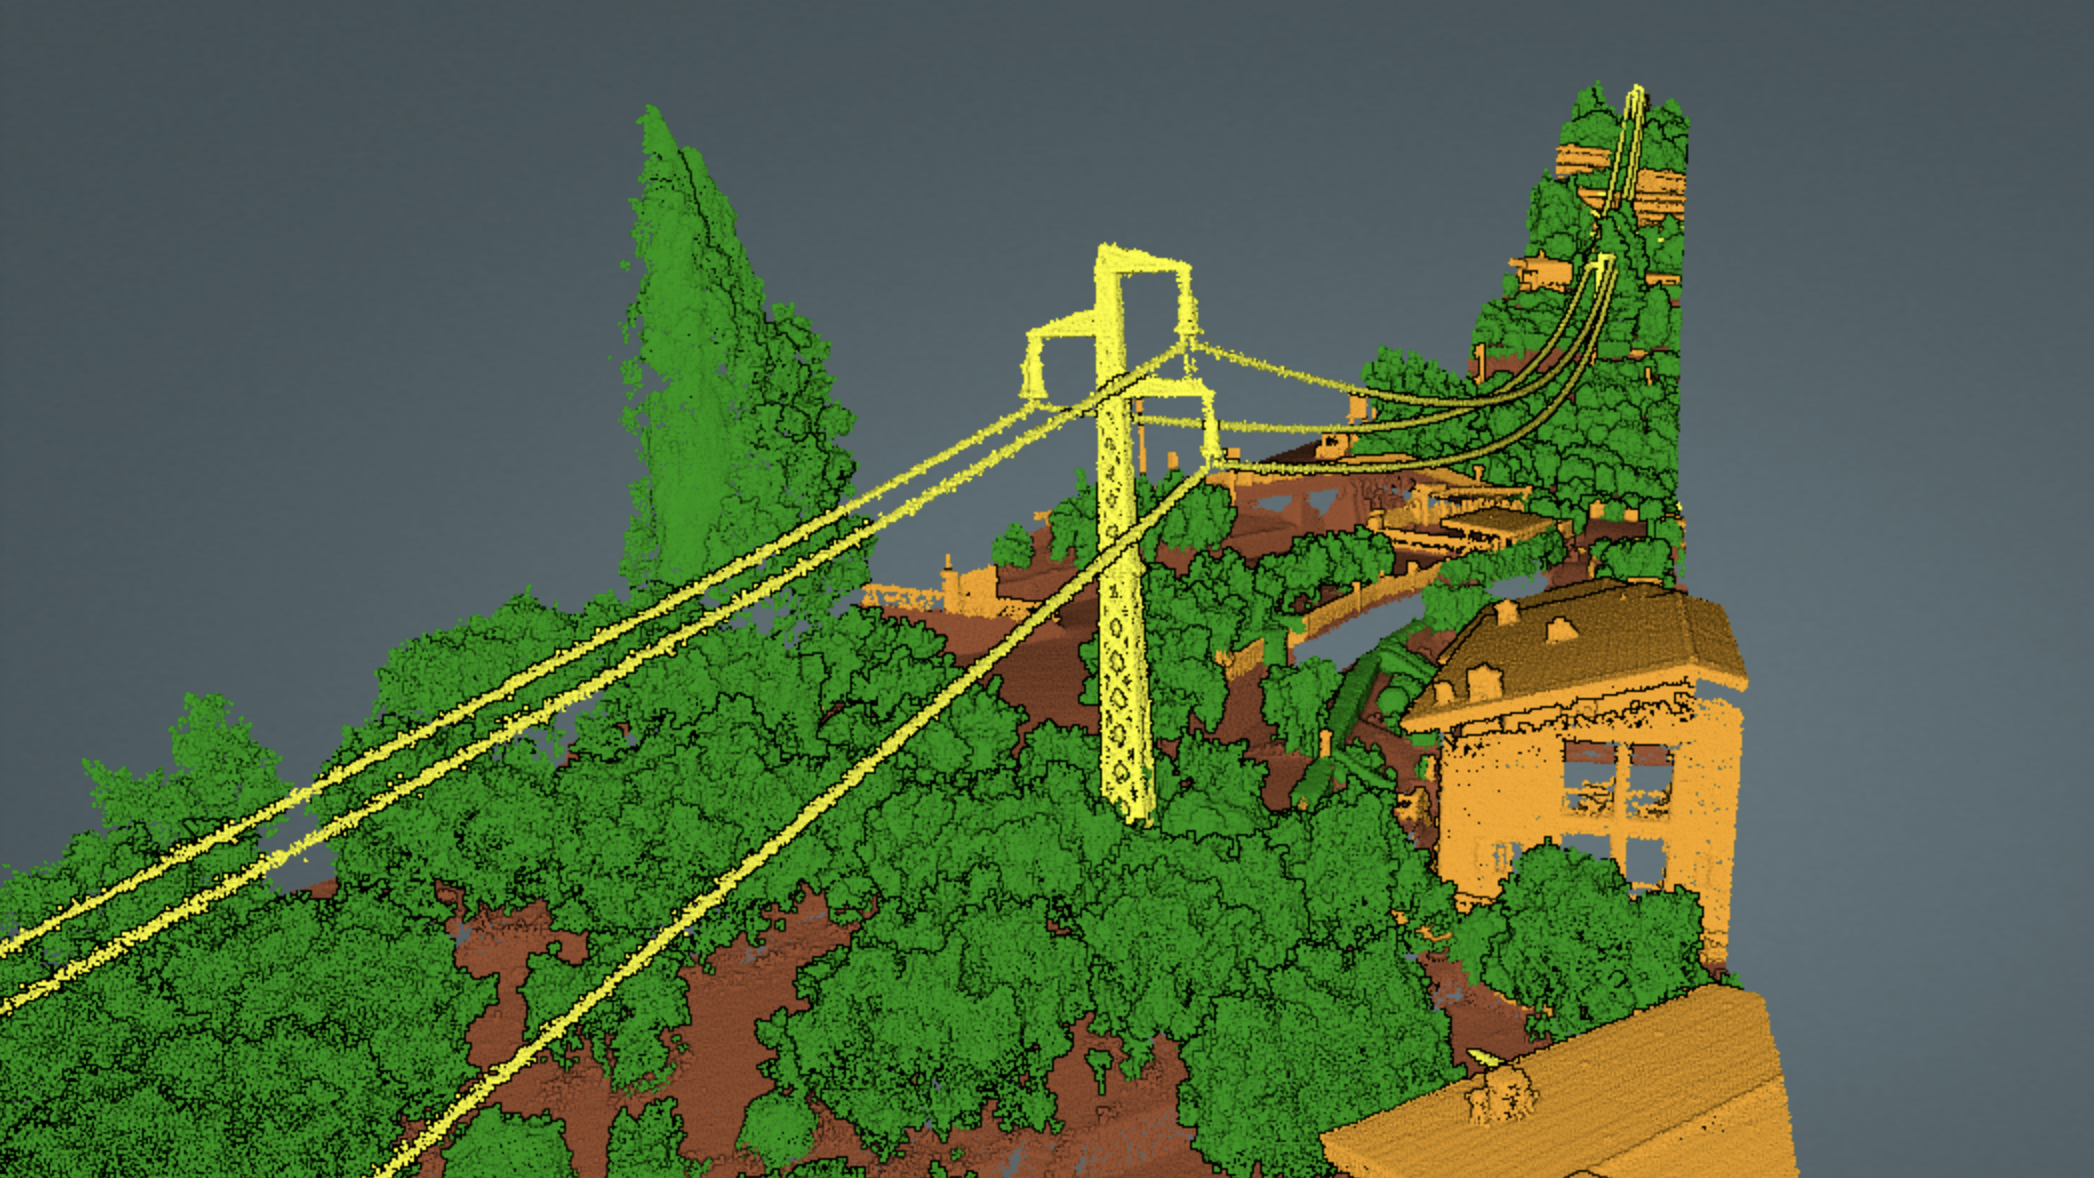
The first pass acquires a dense 3D point cloud of all 35 towers. Once that cloud is aligned, filtered, georeferenced and classified, the exact geometry of every individual tower is known — which is what allows each inspection flight to be planned as a precise, repeatable mission around that specific structure rather than flown manually by an operator judging distance by eye.
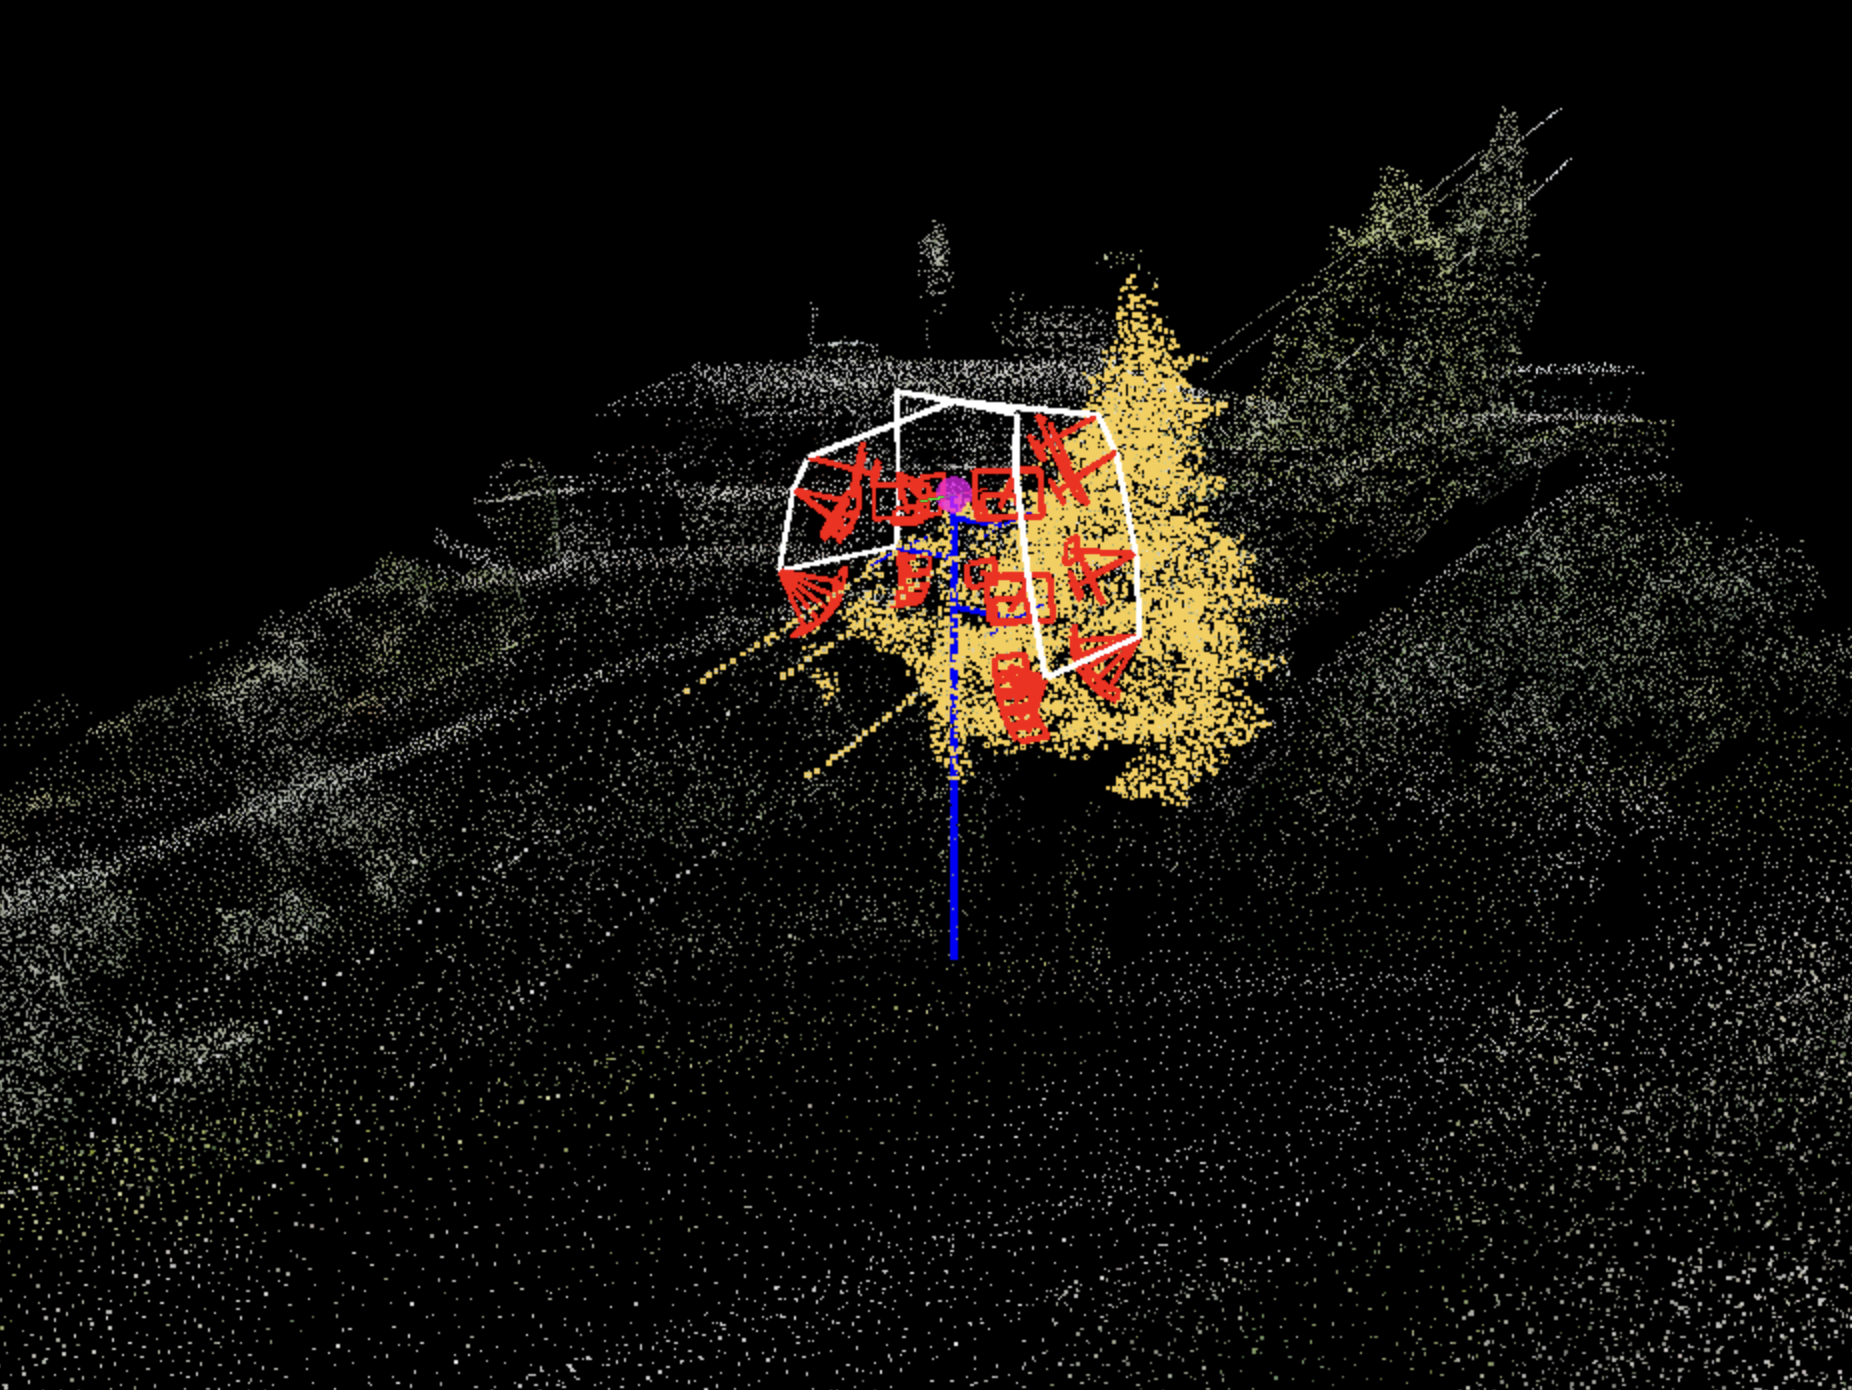
The second pass executes those missions autonomously. The drone flies the pre-computed path and acquires the full set of images for each tower in a fixed sequence, so coverage is systematic by construction rather than dependent on the pilot’s attention.
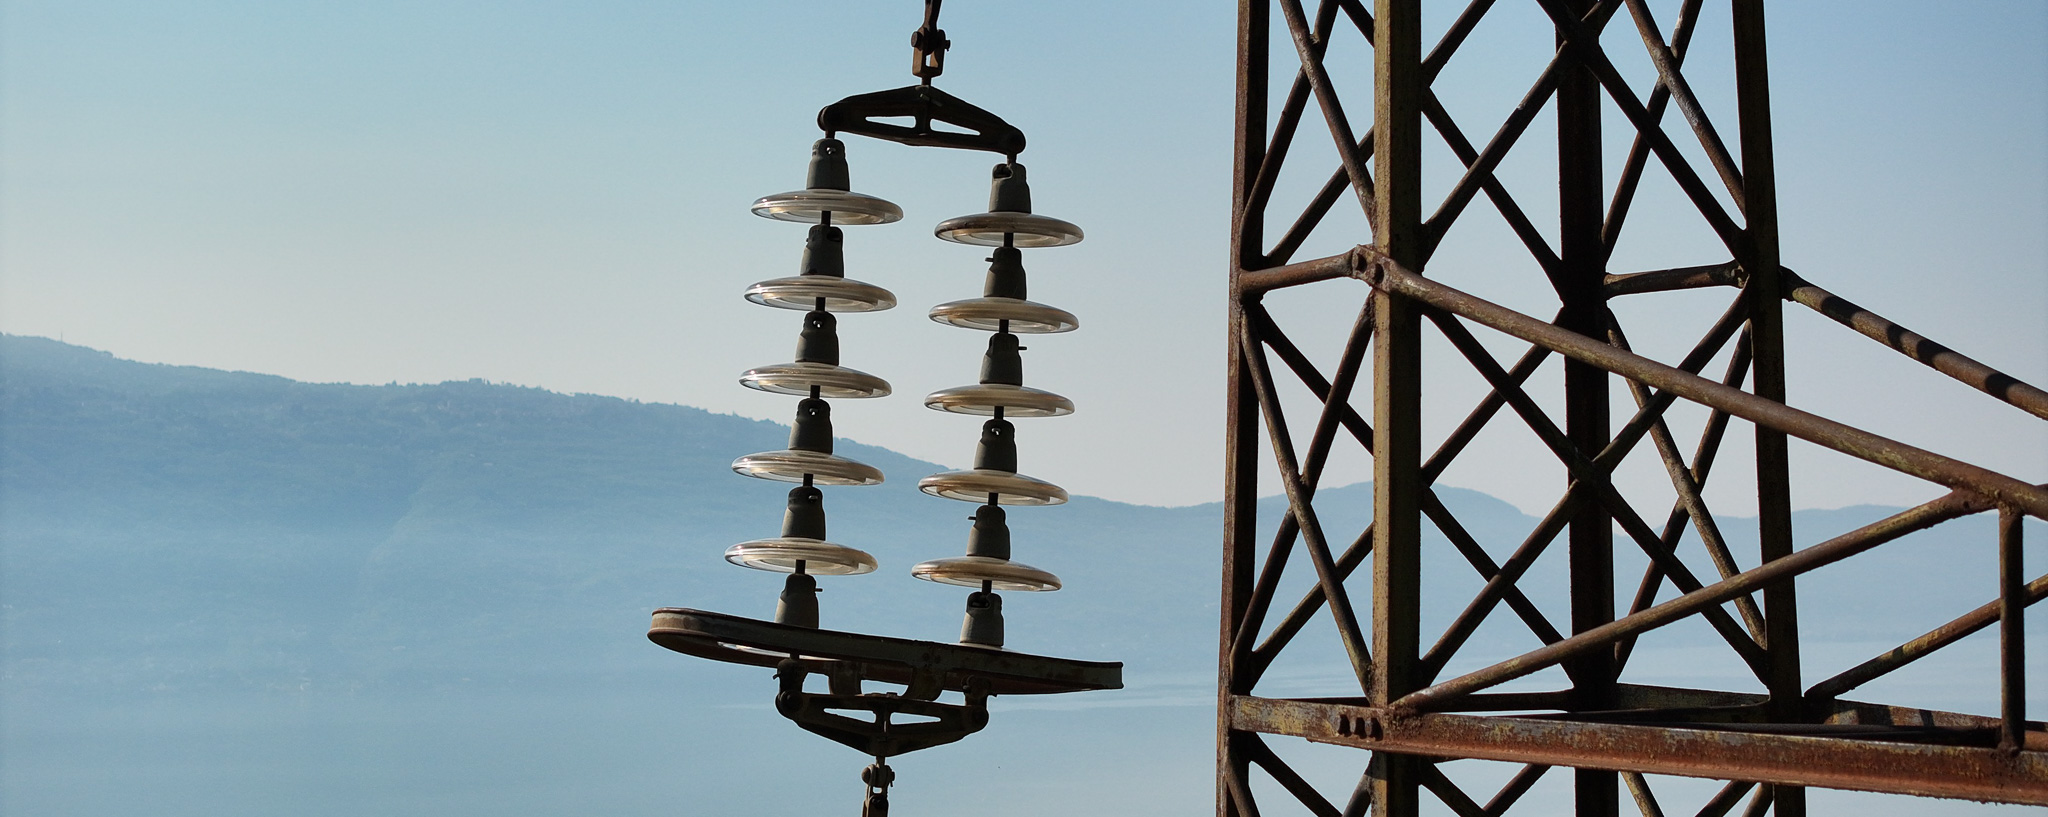
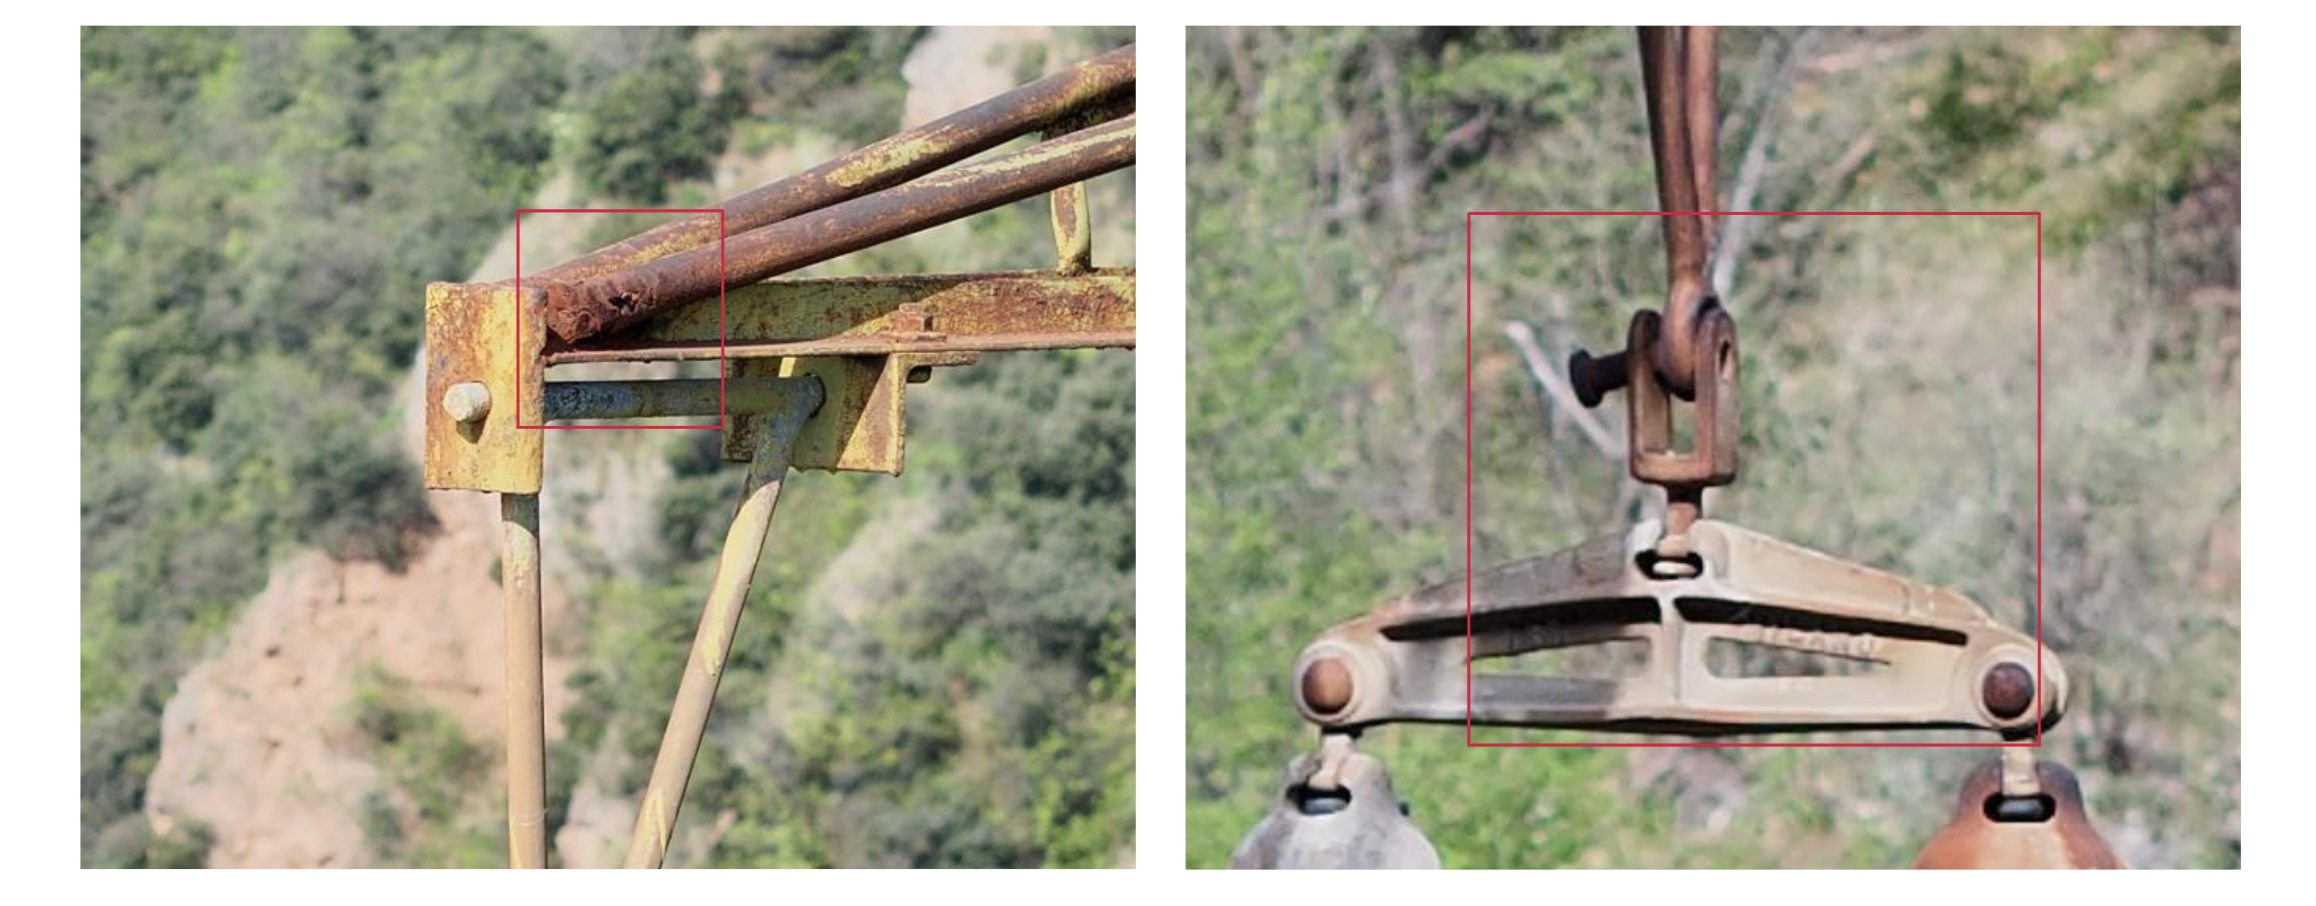
What that produces is the point of the method. Every individual component on every tower is captured in high resolution — each insulator chain, each suspension assembly, each joint and fitting — photographed close, in focus, from an angle chosen because the geometry said it was the right one. A fitting thirty metres up is recorded at a level of detail no observer on the ground or on a platform can match, and it is recorded whether or not anyone had a reason to suspect it.
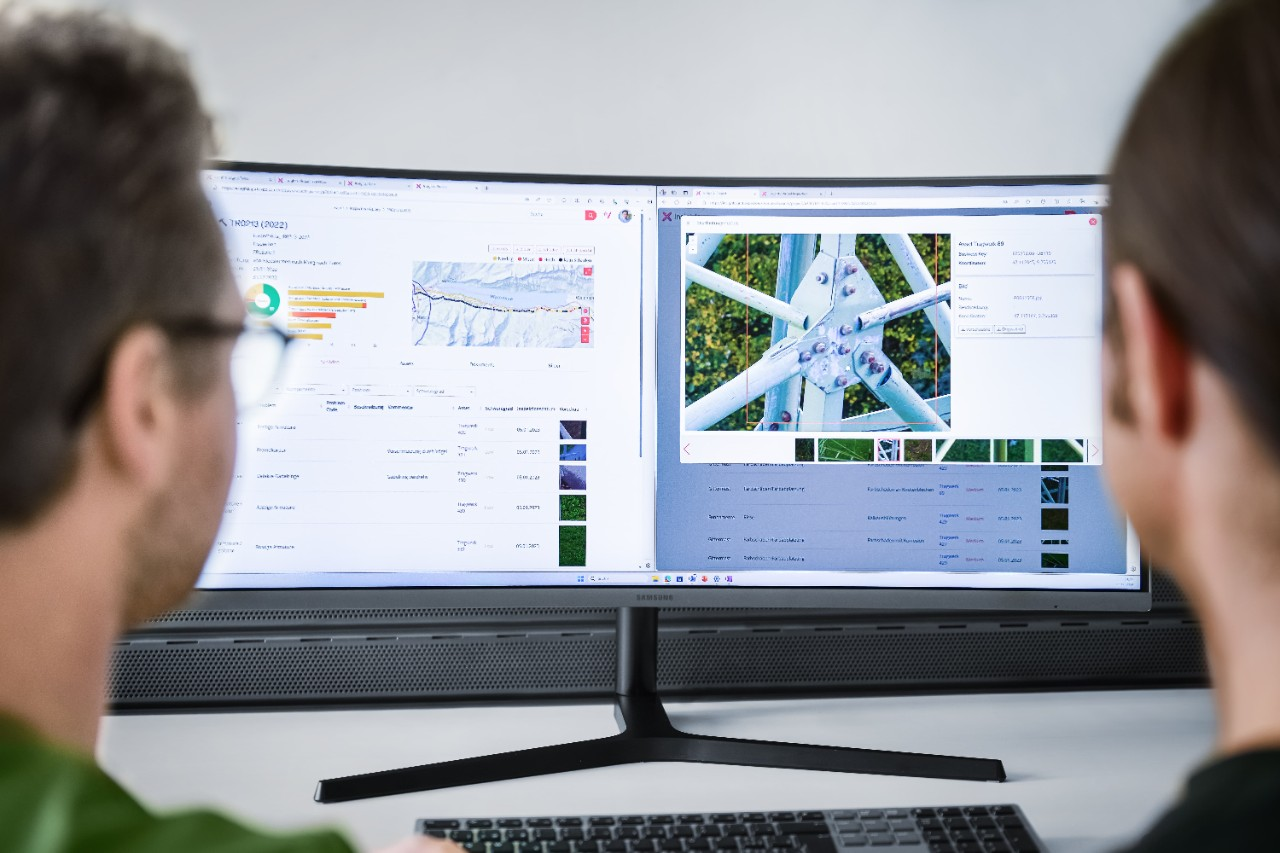
Those images then go through automated analysis. AI detection runs across the full set, flagging corrosion, missing or displaced hardware, burn marks and mechanical damage, and grading each finding by severity. The output is not a gallery. Every finding is tied to the component it belongs to, the tower that component sits on, and a severity class — 1,768 images resolved into a per-element, per-tower condition report that a maintenance planner can sort, filter and act on.
How the campaign works
- Site survey. Ground reconnaissance: access assessment, take-off and landing areas, airspace verification.
- Operational planning. Daily route segments, authorisations, crew briefing and safety coordination.
- LIDAR survey. Point cloud acquisition over all 35 towers with a drone-mounted LIDAR sensor.
- LIDAR processing. Alignment, filtering, georeferencing, structural analysis and point cloud classification.
- Automatic mission planning. Inspection flights computed against the actual 3D geometry of each tower.
- Inspection execution. Autonomous high-resolution image acquisition, systematic component-by-component coverage.
- Analysis and reporting. AI-assisted defect detection, severity classification, per-tower reports and final data package.
Results
No work at height
The exposure that conventional inspection accepts as a cost of doing the job was removed from the job. On this terrain that is not a marginal safety improvement — several of these tower positions are difficult to reach safely on the best day of the year.
Complete coverage, first time
All 35 towers surveyed and inspected with no rework and no return visits — the outcome that Alpine weather windows usually prevent. LIDAR data quality in mountain conditions came in above expectation.
Evidence at component level
Every element of every tower is on file as a high-resolution image, taken from a position computed against the structure’s real geometry. That changes what a maintenance conversation can be about: a disputed finding is settled by opening the frame, not by sending someone back up the tower.
A condition report, not an inspection report
Automated analysis graded each finding by severity and attached it to a specific component on a specific tower. What UNARETI received is a ranked picture of the whole line — which elements are sound, which need watching, which need intervention and in what order — rather than a narrative of what an inspector happened to notice. Prioritising maintenance stops being a judgement made from a document and becomes a query against a dataset.
A record that survives the campaign
Because the acquisition is geometrically defined rather than hand-flown, the next campaign on the same line is directly comparable to this one, component by component. That is the difference between an inspection and a baseline.
Outlook
The value of this method is not visible in a single campaign. A one-off inspection tells an operator what is wrong today; a repeatable, geometrically defined acquisition tells them what is changing, and how fast. Corrosion, vegetation growth and mechanical degradation are all trends before they are faults, and a trend needs two comparable measurements before it exists at all.
The methodology validated on this line extends to the rest of the network without modification: same platforms, same processing chain, same analysis. What changes is only the geometry, and the geometry is acquired, not assumed.
Have a line with no digital baseline?
Tidalis delivers LIDAR surveys and automated inspections on distribution and transmission assets - including the terrain that makes conventional inspections impractical